Simple food over representation analysis (ORA)
Pol Castellano-Escuder
Duke Universitypolcaes@gmail.com
6 May 2024
Source:vignettes/food_enrichment_analysis.Rmd
food_enrichment_analysis.RmdCompiled date: 2024-05-06
Last edited: 2022-01-12
License: GPL-3
Installation
Run the following code to install the Bioconductor version of the package.
# install.packages("BiocManager")
BiocManager::install("fobitools")
Load fobitools
You can also load some additional packages that will be very useful in this vignette.
metaboliteUniverse and metaboliteList
In microarrays, for example, we can study almost all the genes of an organism in our sample, so it makes sense to perform an over representation analysis (ORA) considering all the genes present in Gene Ontology (GO). Since most of the GO pathways would be represented by some gene in the microarray.
This is different in nutrimetabolomics. Targeted nutrimetabolomics studies sets of about 200-500 diet-related metabolites, so it would not make sense to use all known metabolites (for example in HMDB or CHEBI) in an ORA, as most of them would not have been quantified in the study.
In nutrimetabolomic studies it may be interesting to study enriched or over represented foods/food groups by the metabolites resulting from the study statistical analysis, rather than the enriched metabolic pathways, as would make more sense in genomics or other metabolomics studies.
The Food-Biomarker Ontology (FOBI) provides a biological knowledge for conducting these enrichment analyses in nutrimetabolomic studies, as FOBI provides the relationships between several foods and their associated dietary metabolites (Castellano-Escuder et al. 2020).
Accordingly, to perform an ORA with the fobitools
package, it is necessary to provide a metabolite universe (all
metabolites included in the statistical analysis) and a list of selected
metabolites (selected metabolites according to a statistical
criterion).
Here is an example:
# select 300 random metabolites from FOBI
idx_universe <- sample(nrow(fobitools::idmap), 300, replace = FALSE)
metaboliteUniverse <- fobitools::idmap %>%
  dplyr::slice(idx_universe) %>%
  pull(FOBI)

# select 10 random metabolites from metaboliteUniverse that are associated with 'Red meat' (FOBI:0193),
# 'Lean meat' (FOBI:0185) , 'egg food product' (FOODON:00001274),
# or 'grape (whole, raw)' (FOODON:03301702)
fobi_subset <- fobitools::fobi %>% # equivalent to `parse_fobi()`
  filter(FOBI %in% metaboliteUniverse) %>%
  filter(id_BiomarkerOf %in% c("FOBI:0193", "FOBI:0185", "FOODON:00001274", "FOODON:03301702")) %>%
  dplyr::slice(sample(nrow(.), 10, replace = FALSE))

metaboliteList <- fobi_subset %>%
  pull(FOBI)
fobitools::ora(metaboliteList = metaboliteList,
               metaboliteUniverse = metaboliteUniverse,
               subOntology = "food",
pvalCutoff = 0.01)| className | classSize | overlap | pval | padj | overlapMetabolites |
|---|---|---|---|---|---|
| Red meat | 9 | 5 | 0.0000008 | 0.0001084 | FOBI:030687, FOBI:030708, FOBI:030406, FOBI:030689, FOBI:050243 |
| grapefruit (whole, raw) | 14 | 5 | 0.0000116 | 0.0008132 | FOBI:030406, FOBI:030524, FOBI:050243, FOBI:050258, FOBI:050287 |
| Lean meat | 3 | 3 | 0.0000189 | 0.0008799 | FOBI:030687, FOBI:030708, FOBI:030689 |
| apple juice | 9 | 4 | 0.0000448 | 0.0010459 | FOBI:030406, FOBI:050243, FOBI:050258, FOBI:050287 |
| lemon (whole, raw) | 9 | 4 | 0.0000448 | 0.0010459 | FOBI:030406, FOBI:050243, FOBI:050258, FOBI:050287 |
| orange juice | 9 | 4 | 0.0000448 | 0.0010459 | FOBI:030406, FOBI:050243, FOBI:050258, FOBI:050287 |
| orange (whole, raw) | 13 | 4 | 0.0002407 | 0.0043221 | FOBI:030406, FOBI:050243, FOBI:050258, FOBI:050287 |
| black coffee | 2 | 2 | 0.0008027 | 0.0043221 | FOBI:030406, FOBI:050243 |
| black pepper food product | 2 | 2 | 0.0008027 | 0.0043221 | FOBI:030406, FOBI:050243 |
| black tea leaf (dry) | 2 | 2 | 0.0008027 | 0.0043221 | FOBI:030406, FOBI:050243 |
| black turtle bean (whole) | 2 | 2 | 0.0008027 | 0.0043221 | FOBI:030406, FOBI:050243 |
| blueberry (whole, raw) | 2 | 2 | 0.0008027 | 0.0043221 | FOBI:030406, FOBI:050243 |
| chocolate | 2 | 2 | 0.0008027 | 0.0043221 | FOBI:030406, FOBI:050243 |
| green tea leaf (dry) | 2 | 2 | 0.0008027 | 0.0043221 | FOBI:030406, FOBI:050243 |
| kale leaf (raw) | 2 | 2 | 0.0008027 | 0.0043221 | FOBI:030406, FOBI:050243 |
| pea (whole) | 2 | 2 | 0.0008027 | 0.0043221 | FOBI:030406, FOBI:050243 |
| pomegranate (whole, raw) | 2 | 2 | 0.0008027 | 0.0043221 | FOBI:030406, FOBI:050243 |
| prune food product | 2 | 2 | 0.0008027 | 0.0043221 | FOBI:030406, FOBI:050243 |
| red tea | 2 | 2 | 0.0008027 | 0.0043221 | FOBI:030406, FOBI:050243 |
| red velvet | 2 | 2 | 0.0008027 | 0.0043221 | FOBI:030406, FOBI:050243 |
| stem or spear vegetable | 2 | 2 | 0.0008027 | 0.0043221 | FOBI:030406, FOBI:050243 |
| turnip (whole, raw) | 2 | 2 | 0.0008027 | 0.0043221 | FOBI:030406, FOBI:050243 |
| white bread | 2 | 2 | 0.0008027 | 0.0043221 | FOBI:030406, FOBI:050243 |
| White fish | 2 | 2 | 0.0008027 | 0.0043221 | FOBI:030406, FOBI:050243 |
| white sugar | 2 | 2 | 0.0008027 | 0.0043221 | FOBI:030406, FOBI:050243 |
| white wine | 2 | 2 | 0.0008027 | 0.0043221 | FOBI:030406, FOBI:050243 |
| apricot (whole, raw) | 3 | 2 | 0.0023703 | 0.0100559 | FOBI:030406, FOBI:050243 |
| black currant (whole, raw) | 3 | 2 | 0.0023703 | 0.0100559 | FOBI:030406, FOBI:050243 |
| blackberry (whole, raw) | 3 | 2 | 0.0023703 | 0.0100559 | FOBI:030406, FOBI:050243 |
| broccoli floret (whole, raw) | 3 | 2 | 0.0023703 | 0.0100559 | FOBI:050243, FOBI:050258 |
| cauliflower (whole, raw) | 3 | 2 | 0.0023703 | 0.0100559 | FOBI:030406, FOBI:050243 |
| peach (whole, raw) | 3 | 2 | 0.0023703 | 0.0100559 | FOBI:030406, FOBI:050243 |
| raspberry (whole, raw) | 3 | 2 | 0.0023703 | 0.0100559 | FOBI:030406, FOBI:050243 |
| pear (whole, raw) | 4 | 2 | 0.0046664 | 0.0176565 | FOBI:030406, FOBI:050243 |
| plum (whole, raw) | 4 | 2 | 0.0046664 | 0.0176565 | FOBI:030406, FOBI:050243 |
| strawberry (whole, raw) | 4 | 2 | 0.0046664 | 0.0176565 | FOBI:030406, FOBI:050243 |
| tea food product | 4 | 2 | 0.0046664 | 0.0176565 | FOBI:050243, FOBI:050258 |
| wine (food product) | 14 | 3 | 0.0057940 | 0.0213463 | FOBI:030406, FOBI:050243, FOBI:050258 |
| bean (whole) | 5 | 2 | 0.0076553 | 0.0267937 | FOBI:030406, FOBI:050243 |
| onion (whole, raw) | 5 | 2 | 0.0076553 | 0.0267937 | FOBI:050243, FOBI:050258 |
Network visualization of metaboliteList terms
Then, with the fobi_graph function we can visualize the
metaboliteList terms with their corresponding FOBI
relationships.
terms <- fobi_subset %>%
  pull(id_code)

# create the associated graph
fobitools::fobi_graph(terms = terms,
                      get = "anc",
                      labels = TRUE,
                      legend = TRUE)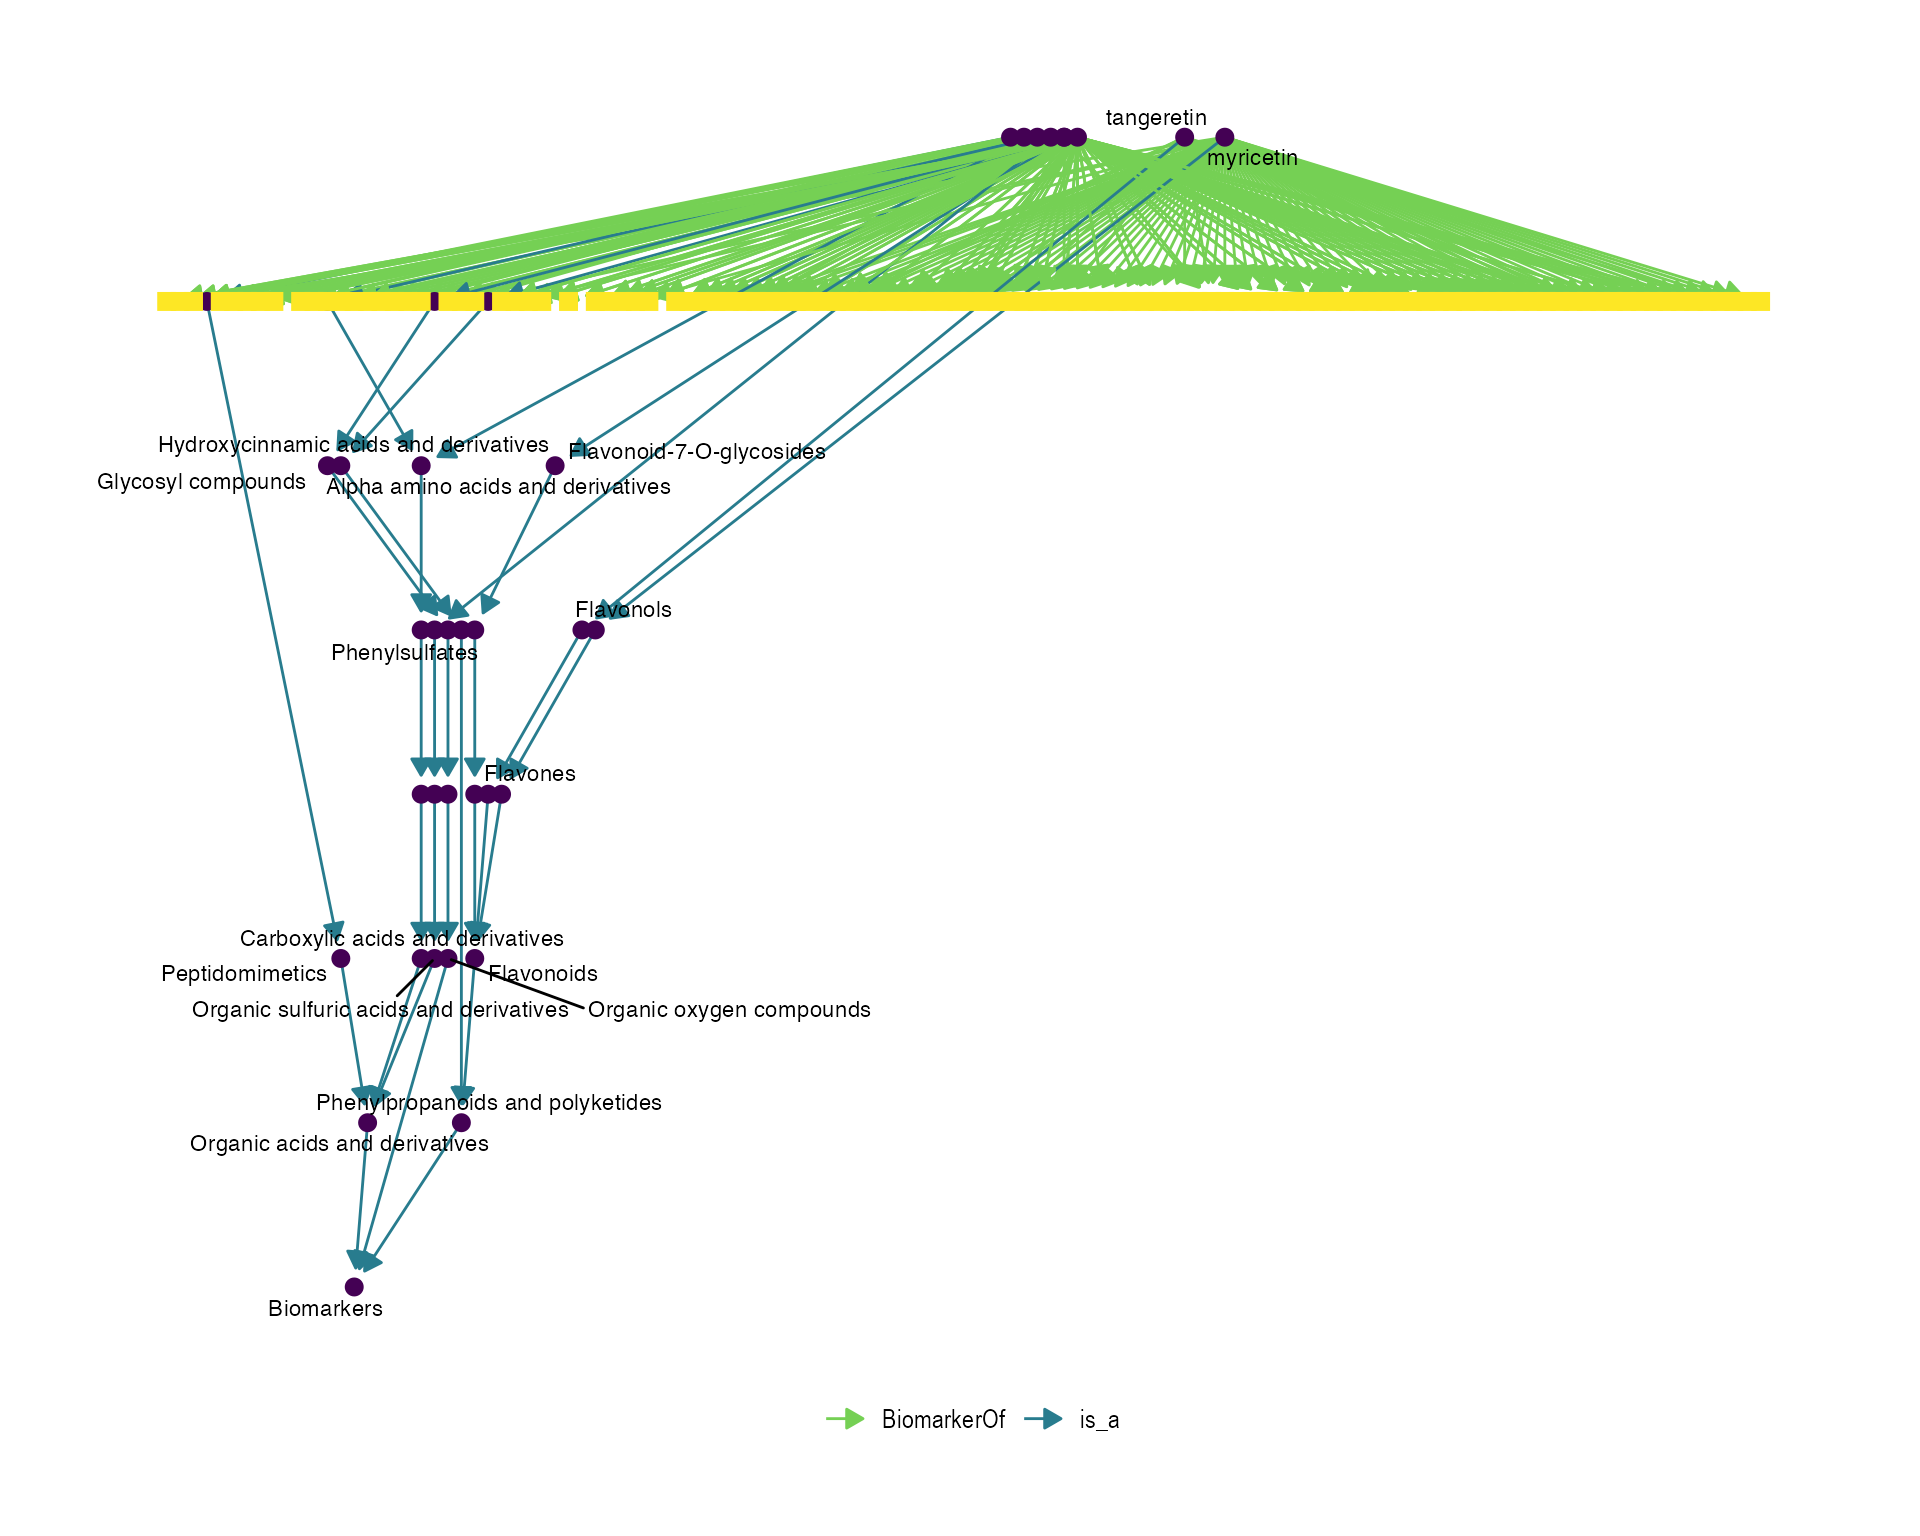
Session Information
sessionInfo()
#> R version 4.3.2 (2023-10-31)
#> Platform: aarch64-apple-darwin20 (64-bit)
#> Running under: macOS Sonoma 14.1
#>
#> Matrix products: default
#> BLAS:   /Library/Frameworks/R.framework/Versions/4.3-arm64/Resources/lib/libRblas.0.dylib
#> LAPACK: /Library/Frameworks/R.framework/Versions/4.3-arm64/Resources/lib/libRlapack.dylib;  LAPACK version 3.11.0
#>
#> locale:
#> [1] en_US.UTF-8/en_US.UTF-8/en_US.UTF-8/C/en_US.UTF-8/en_US.UTF-8
#>
#> time zone: America/New_York
#> tzcode source: internal
#>
#> attached base packages:
#> [1] stats     graphics  grDevices utils     datasets  methods   base
#>
#> other attached packages:
#> [1] kableExtra_1.3.4 dplyr_1.1.4      fobitools_1.11.2 BiocStyle_2.30.0
#>
#> loaded via a namespace (and not attached):
#>   [1] DBI_1.2.0              ada_2.0-5              qdapRegex_0.7.8
#>   [4] gridExtra_2.3          rlang_1.1.3            magrittr_2.0.3
#>   [7] e1071_1.7-14           compiler_4.3.2         RSQLite_2.3.4
#>  [10] systemfonts_1.0.5      vctrs_0.6.5            rvest_1.0.3
#>  [13] stringr_1.5.1          pkgconfig_2.0.3        crayon_1.5.2
#>  [16] fastmap_1.1.1          labeling_0.4.3         ggraph_2.1.0
#>  [19] utf8_1.2.4             rmarkdown_2.25         tzdb_0.4.0
#>  [22] prodlim_2023.08.28     ragg_1.2.7             purrr_1.0.2
#>  [25] bit_4.0.5              xfun_0.41              cachem_1.0.8
#>  [28] jsonlite_1.8.8         blob_1.2.4             highr_0.10
#>  [31] tictoc_1.2             BiocParallel_1.36.0    tweenr_2.0.2
#>  [34] parallel_4.3.2         R6_2.5.1               bslib_0.6.1
#>  [37] stringi_1.8.3          textclean_0.9.3        parallelly_1.36.0
#>  [40] rpart_4.1.23           jquerylib_0.1.4        Rcpp_1.0.12
#>  [43] bookdown_0.37          knitr_1.45             future.apply_1.11.1
#>  [46] clisymbols_1.2.0       Matrix_1.6-1           splines_4.3.2
#>  [49] nnet_7.3-19            igraph_1.6.0           tidyselect_1.2.0
#>  [52] rstudioapi_0.15.0      yaml_2.3.8             viridis_0.6.4
#>  [55] codetools_0.2-19       listenv_0.9.0          lattice_0.22-5
#>  [58] tibble_3.2.1           withr_2.5.2            evaluate_0.23
#>  [61] ontologyIndex_2.11     future_1.33.1          desc_1.4.3
#>  [64] survival_3.5-7         proxy_0.4-27           polyclip_1.10-6
#>  [67] xml2_1.3.6             pillar_1.9.0           BiocManager_1.30.22
#>  [70] generics_0.1.3         vroom_1.6.5            ggplot2_3.4.4
#>  [73] munsell_0.5.0          scales_1.3.0           ff_4.0.12
#>  [76] globals_0.16.2         xtable_1.8-4           class_7.3-22
#>  [79] glue_1.7.0             RecordLinkage_0.4-12.4 tools_4.3.2
#>  [82] data.table_1.14.10     webshot_0.5.5          fgsea_1.28.0
#>  [85] fs_1.6.3               graphlayouts_1.0.2     fastmatch_1.1-4
#>  [88] tidygraph_1.3.0        cowplot_1.1.2          grid_4.3.2
#>  [91] tidyr_1.3.0            ipred_0.9-14           colorspace_2.1-0
#>  [94] ggforce_0.4.1          cli_3.6.2              evd_2.3-6.1
#>  [97] textshaping_0.3.7      fansi_1.0.6            viridisLite_0.4.2
#> [100] svglite_2.1.3          lava_1.7.3             gtable_0.3.4
#> [103] sass_0.4.8             digest_0.6.34          ggrepel_0.9.5
#> [106] farver_2.1.1           memoise_2.0.1          htmltools_0.5.7
#> [109] pkgdown_2.0.7          lifecycle_1.0.4        httr_1.4.7
#> [112] bit64_4.0.5            MASS_7.3-60