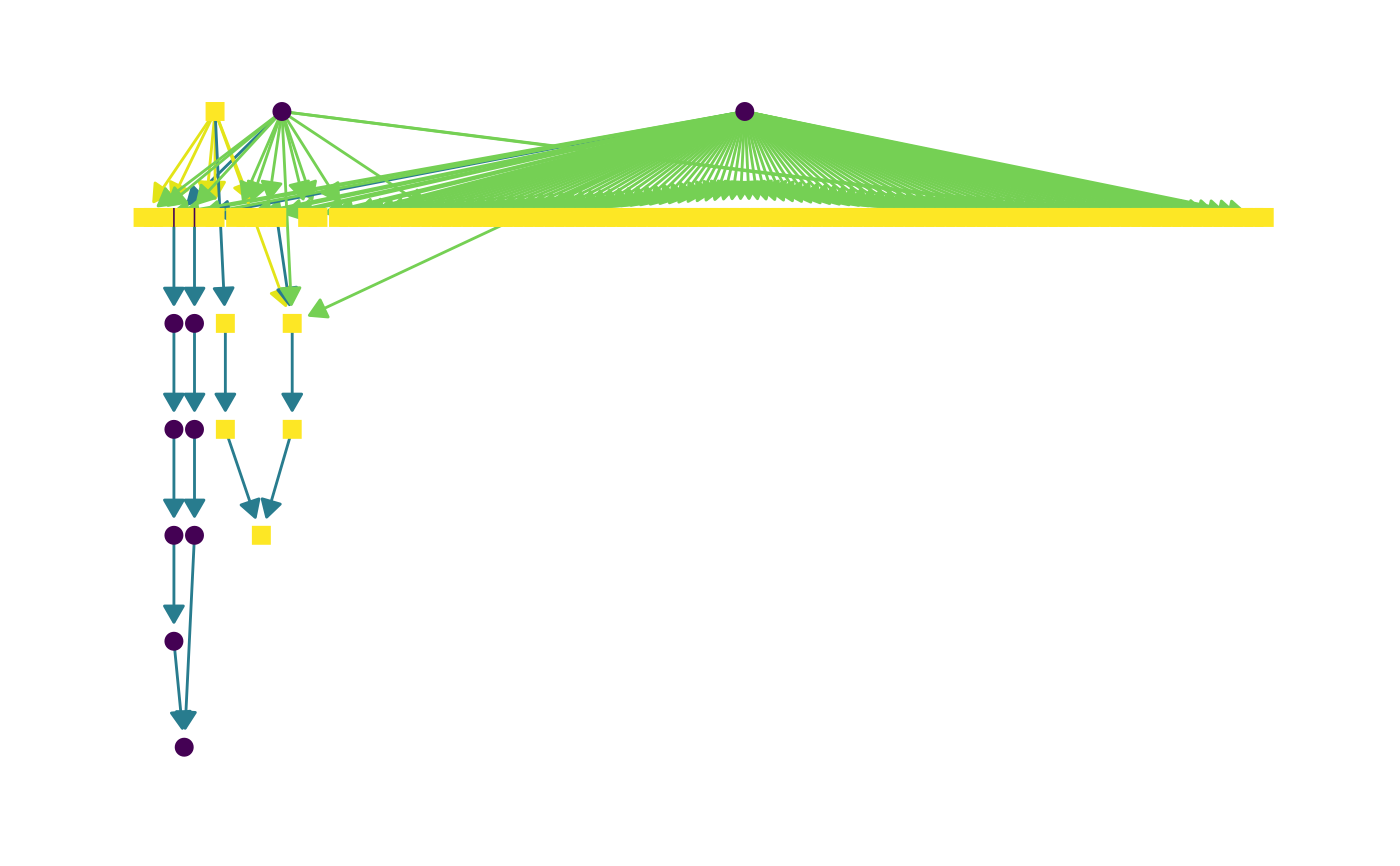
This function allows users to create networks based on FOBI relationships.
Arguments
- terms
A character vector with FOBI term IDs.
- get
A character string indicating desired relationships between provided terms. Options are 'anc' (for ancestors) and 'des' (for descendants). Default is NULL and all information related with input terms will be provided.
- property
A character vector indicating which properties should be plotted. Options are 'is_a', 'BiomarkerOf', and 'Contains'. By default all of them are included.
- layout
A character string indicating the type of layout to create. Options are 'sugiyama' (default) and 'lgl'.
- labels
Logical indicating if node names should be plotted or not.
- labelsize
Numeric value indicating the size of labels.
- legend
Logical indicating if legend should be plotted or not.
- legendSize
Numeric value indicating the size of legend.
- legendPos
A character string indicating the legend position (if legend parameter is set to TRUE). Options are 'bottom' (default) and 'top'.
- curved
Logical indicating if the shape of the edges shape should be curved or not.
- pointSize
Numeric value indicating the size of graph points.
- fobi
FOBI table obtained with `parse_fobi()`. If this value is set to NULL, the last version of FOBI will be downloaded from GitHub.
Value
A ggraph object.
References
Pol Castellano-Escuder, Raúl González-Domínguez, David S Wishart, Cristina Andrés-Lacueva, Alex Sánchez-Pla, FOBI: an ontology to represent food intake data and associate it with metabolomic data, Database, Volume 2020, 2020, baaa033, https://doi.org/10.1093/databa/baaa033.
Examples
terms <- c("CHEBI:16164","CHEBI:16243","FOODON:00001139","FOODON:00003274","FOODON:00003275")
fobi_graph(terms, get = "anc")


# Red meat related FOBI biomarkers
fobi_graph(terms = "FOBI:0193",
           property = c("is_a", "BiomarkerOf"),
           layout = "lgl", curved = TRUE) # set labels = TRUE to display node names
